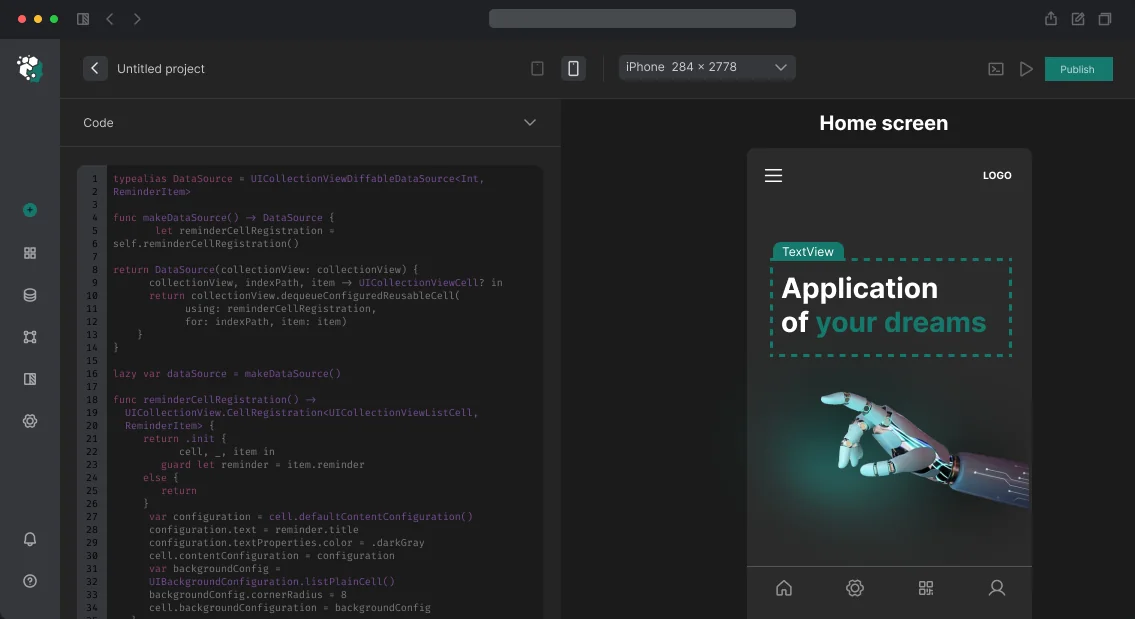
Integrate Dynatrace for Mobile App Monitoring (APM)
Your mobile app lags on the payment screen, and the crash-free rate dropped below 99%? On one e-commerce project, the app lost 15% conversion due to lag on checkout: Dynatrace revealed that a third-party payment SDK was blocking the UI thread. We replaced the synchronous call with an asynchronous background queue, and conversion recovered within 2 days. In another case, Davis AI automatically identified that a 15% increase in response time was caused by a load balancer configuration change, saving 3 hours of manual searching. We help integrate OneAgent so you see every HTTP call, UI delay, and crash in real time. Within 3 days you get a clean performance picture, not a pile of logs.
Unlike Datadog or New Relic, Dynatrace uses the Davis AI engine for automatic anomaly detection and distributed tracing without manual tagging. Compared to competitors, Davis finds root causes 60% faster, and Smartscape visualizes dependencies between microservices. But installing the SDK is just the beginning: you need to configure beacon URLs, User Actions for key scenarios, and backend correlation. We have completed over 50 integrations and know where the pitfalls usually lie — from double initialization to obfuscated stack traces.
How to Install OneAgent on a Mobile Platform?
Installation steps:
- Add dependency in Podfile or SPM.
- Specify Application ID and Beacon URL in Info.plist.
- Call
Dynatrace.startupWithConfig(nil) at app startup.
iOS:
// Podfile
pod 'Dynatrace', '~> 8.0'

// Or Swift Package Manager
.package(url: "https://github.com/Dynatrace/swift-mobile-sdk", from: "8.0.0")
import Dynatrace

// Info.plist or programmatic init
DTXApplicationID = "your-application-id"
DTXBeaconURL = "https://your-environment.live.dynatrace.com/mbeacon"

// In code:
Dynatrace.startupWithConfig(nil)
Android:
// build.gradle (project)
classpath("com.dynatrace.tools.android:gradle-plugin:8.+")

// build.gradle (app)
apply plugin: 'com.dynatrace.instrumentation'
// assets/dynatrace.properties
DTXApplicationID=your-application-id
DTXBeaconURL=https://your-environment.live.dynatrace.com/mbeacon
Additional configuration
For iOS, you can also use Dynatrace.startupWithConfig(config) with custom parameters, e.g., to enable sampling or disable automatic tracing.
User Action: Setup and Usage
Dynatrace groups everything that happens between a user touch and the completion of operations into a User Action entity. This is key to understanding why a user leaves a screen.
let action = Dynatrace.enterAction("AddToCart")
// ... perform work ...
action?.leaveAction()
Inside enterAction/leaveAction, any URLSession request is automatically attached to that action. On the dashboard, a waterfall view appears: gesture → sync → API → render. No manual tagging.
How Does Dynatrace Correlate Client and Server?
Dynatrace supports W3C traceparent and its own x-dynatrace. For automatic tracing, simply add headers on the backend. In Smartscape, the entire path from a mobile click to the database is visible on one screen. This cuts problem diagnosis time in half.
Typical Integration Mistakes
- Double initialization. In SwiftUI + SceneDelegate,
startupWithConfig may be called twice, resetting the session ID.
- ProGuard and R8. Without
uploadEnabled = true, stack traces remain obfuscated. For proper setup, refer to ProGuard documentation.
- Beacon URL in debug. Don't forget to switch URLs for dev/staging, otherwise metrics become polluted.
Comparison of Dynatrace with Alternatives
| Criterion |
Dynatrace (APM) |
Datadog |
New Relic |
| AI analytics |
Davis (built-in) |
Watchdog |
Applied Intelligence |
| Auto-instrumentation |
OneAgent |
APM agent |
Browser/Agent |
| User Actions |
Yes |
No |
Yes (via RUM) |
| Distributed tracing |
W3C + proprietary |
W3C |
W3C |
| Average time to find problem |
5 min |
15 min |
12 min |
Dynatrace wins on complex microservice scenarios — Smartscape shows real-time dependencies between components. In practice, this yields up to 40% time savings in diagnosis, and with Davis, MTTR is reduced by 60%.
What Our Work Includes
| Stage |
What We Do |
Duration |
| Audit current app |
Identify integration points, team size |
1 day |
| Install OneAgent |
Configure SDK for iOS/Android |
1 day |
| Configure User Actions |
Define key scenarios |
0.5 day |
| Distributed tracing |
Set up backend correlation |
0.5 day |
| Analysis and dashboards |
Visualize metrics, set up alerts |
1 day |
Timeline: from 3 to 5 days depending on complexity. Pricing is determined individually. Get a consultation — we'll assess your project in one day.
Our Advantages
We have 5+ years of experience with Dynatrace and over 50 mobile app monitoring projects. Certified engineers, post-integration support guarantee. Contact us — we'll evaluate your project in one day. Order an audit of your current app, and we'll show which scenarios to optimize first.
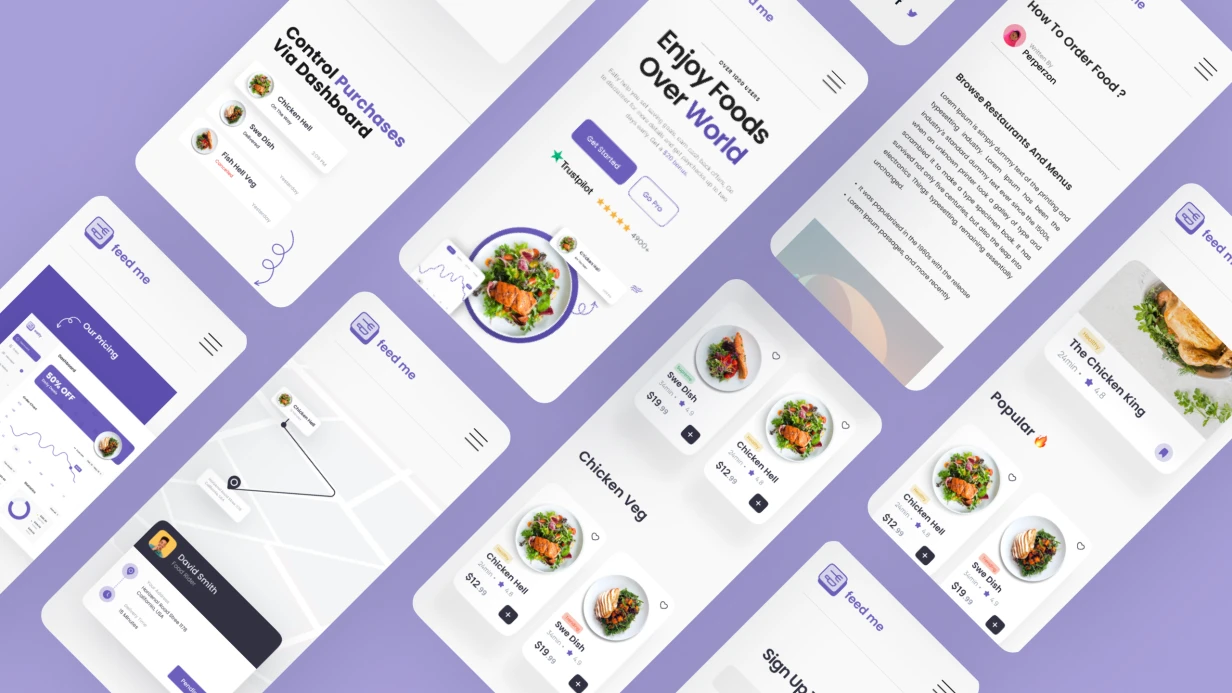
Mobile App Analytics: Firebase, Amplitude, AppsFlyer and Attribution
Our team regularly encounters projects where analytics is already "set up" but yields no real insights. A typical example is a startup with 50k DAU: tracking dozens of events without a single answer to the question "why don't users reach payment?". In two weeks we built a basic funnel and found that 70% of users drop off at the phone number verification screen. After fixing the bug, retention increased by 12%. The takeaway: analytics should start with specific questions, not tracking everything indiscriminately.
Why Event Taxonomy is the Foundation of Mobile App Analytics?
Firebase Analytics, Amplitude, Mixpanel — technically similar. The difference lies in what you put into them. A common mistake: events like screen_view, button_tap_1, button_tap_2 without context. A month later, no one remembers what button_tap_2 means.
Proper taxonomy: object + action + context. product_viewed, checkout_started, payment_completed with parameters product_id, category, price, source. This allows building funnels, cohort analysis, and retention without additional tracking.
We document the naming convention in a tracking plan — a document (Google Sheet or Amplitude Data Catalog) describing every event, its parameters, and triggering conditions. The tracking plan is synced with the analytics team before development begins, not after. This approach ensures that data remains interpretable months later and doesn't become a dump. Experience from 50+ projects confirms: without a tracking plan, analytics maintenance costs increase 2-3 times due to rework.
What Should You Choose for Mobile App Analytics: Firebase, Amplitude, or Mixpanel?
The table below highlights key differences between the three popular platforms. Choice depends on budget, traffic, and tasks.
| Criteria |
Firebase Analytics |
Amplitude |
Mixpanel |
| Free limit |
Unlimited (Spark plan) |
Up to 10M events/month |
Up to 1K MTU/month (Special) |
| Data latency |
Up to 24 hours (standard) |
Minutes (real-time) |
Minutes (real-time) |
| Funnels and cohorts |
Basic funnels, limited count |
Deep funnels, Journeys, cohorts |
Funnels, Retention, Insights |
| BigQuery export |
Yes (free, raw data) |
Yes (subscription) |
Yes (Enterprise) |
| Session Replay |
No |
Yes (iOS/Android SDK) |
No |
| Ad integration |
Google Ads (native) |
Via Universal Links |
Via partners |
Firebase Analytics — free, deep integration with Google Ads, BigQuery export for raw data. Limitations: data latency up to 24 hours, limited funnels. For startups with Google Ads traffic, it's the first choice.
Amplitude — product analytics focused on cohorts and user journeys. Journeys (formerly Pathfinder) shows actual paths between events — not assumed funnels but real routes. Session Replay records sessions for UX analysis. The free tier up to 10M events/month is enough for most products at launch.
Mixpanel — close to Amplitude, stronger in real-time segmentation. Insights, Funnels, Retention cover 90% of product analysts' tasks.
How to Solve Multi-Channel Attribution with AppsFlyer?
Knowing where a user came from is a separate task. Firebase Attribution works only within the Google ecosystem. For multi-channel attribution (Facebook Ads, TikTok, Apple Search Ads, programmatic), an MMP (Mobile Measurement Partner) is needed.
AppsFlyer is the market leader. OneLink — universal deep link working on iOS and Android, correctly attributing installs from any channel. Protect360 — built-in fraud protection (fake installs, click injection on Android). Adjust and Branch are competitors with similar features. Branch excels in deep linking; Adjust is popular in gaming.
According to Apple, with iOS 14.5, apps must obtain user permission via ATT before collecting IDFA for tracking. AppsFlyer uses probabilistic matching (IP + user agent + timing) for these users — accuracy is lower but better than nothing. SKAdNetwork and Privacy Preserving Attribution provide aggregated data from Apple with a 24-72 hour delay.
How to Set Up Crash Analytics to Not Miss Bugs?
Firebase Crashlytics is the standard for crash reporting. It automatically groups crashes by stack trace, shows affected users %, and sends velocity alerts when crash rate increases by more than 10% per hour.
Important: symbolication. On iOS, .dSYM files must be automatically uploaded with each build — via Fastlane upload_symbols_to_crashlytics or Xcode Cloud built-in. Without symbols, crashes in Crashlytics appear as memory addresses. This happens more often than expected when switching to a new CI — in one project with 500k users, we found that 40% of crashes remained unsymbolicated due to a missing CI/CD step. After automation, bug response time dropped from 3 hours to 15 minutes.
For React Native and Flutter, @sentry/react-native and sentry_flutter provide additional context: breadcrumbs, network requests before the crash, Redux/Provider state.
Below is a comparison of popular crash analytics tools to choose according to your needs.
| Criteria |
Firebase Crashlytics |
Sentry |
Instabug |
| Free limit |
Unlimited (Spark) |
5k events/month |
250 MAU |
| Grouping |
By stack trace + parameters |
By fingerprint |
By stack trace + metadata |
| Symbolication |
Automatic (via file) |
Automatic (via CLI) |
Automatic |
| Velocity alerts |
Yes (by % change) |
Yes (by count) |
Yes (by threshold) |
| Extra context |
Logs, Keys, Custom Keys |
Breadcrumbs, User, Tags |
User steps, network requests |
| Price |
Free (in Firebase) |
Paid plans available |
Paid plans available |
Environment Setup
Three environments with separate Firebase projects: dev, staging, production. Mixing analytics from test sessions and production is a common mistake that skews all metrics. On iOS via GoogleService-Info.plist per scheme, on Android via google-services.json in each flavor folder.
Timelines: basic analytics with Firebase + Crashlytics — 3-5 days. Full tracking plan + Amplitude/Mixpanel with funnels and cohorts — 2-3 weeks. Attribution via AppsFlyer with deep linking and fraud protection — 1-2 weeks. Cost is calculated individually based on integration complexity.
What Is Included in Our Work
As part of analytics implementation, we provide:
- Development and approval of a tracking plan with product and marketing teams.
- SDK integration (Firebase, Amplitude, Mixpanel, AppsFlyer) considering your stack (Swift/Kotlin/Flutter/React Native).
- Setup of funnels, cohorts, dashboards, and alerts.
- Automation of symbolication and .dSYM upload via Fastlane.
- Documentation of events and parameters.
- Team training on the analytics platform.
- Two weeks of post-release support and tracking adjustments.
Our experience: 7 years of analytics implementation and over 80 successful projects in mobile development. We guarantee data correctness and transparency at every stage.
Contact us for a consultation on setting up analytics for your app. Request an audit of your current analytics — and we will show you which metrics you are losing.