

Scientific research loses value without clear visual demonstration
Scientific research accumulates vast amounts of data, but without quality visualization, these results remain unclear. Complex charts, tables, and reports fail to resonate with audiences, partners, or investors — they see numbers, not discoveries. As a result, the research loses its value even when carried out at a high level.
Research presentations become a formality: slides are overloaded, key findings get lost, and listeners quickly lose interest. This is especially critical when project funding depends on a partner's or management's decision. Without clear visual demonstration, scientific data doesn't work for you.
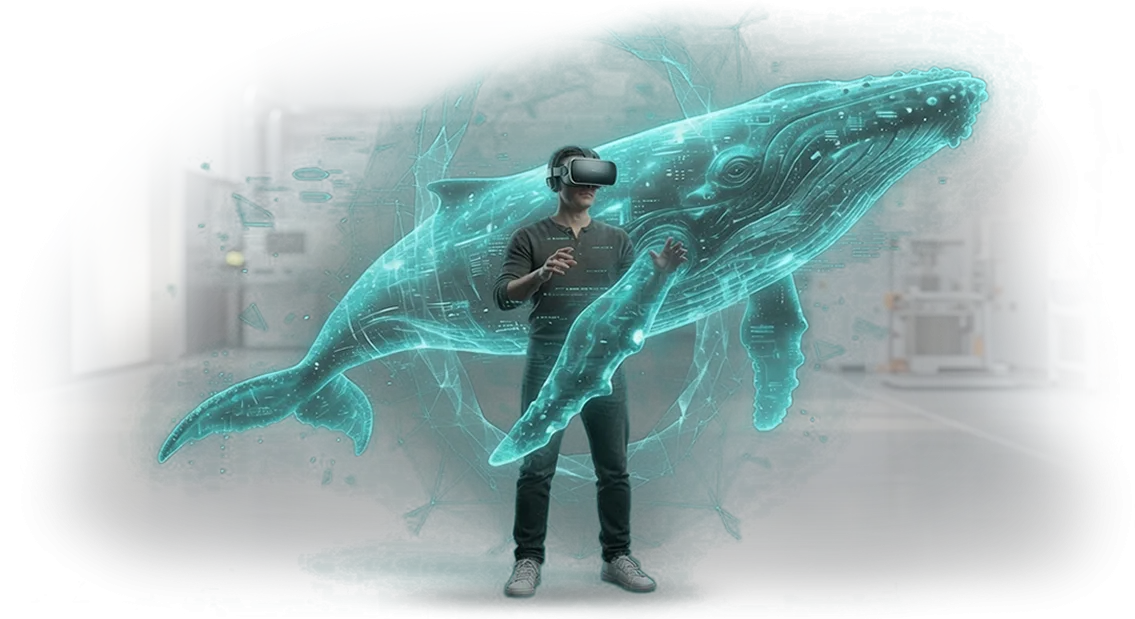
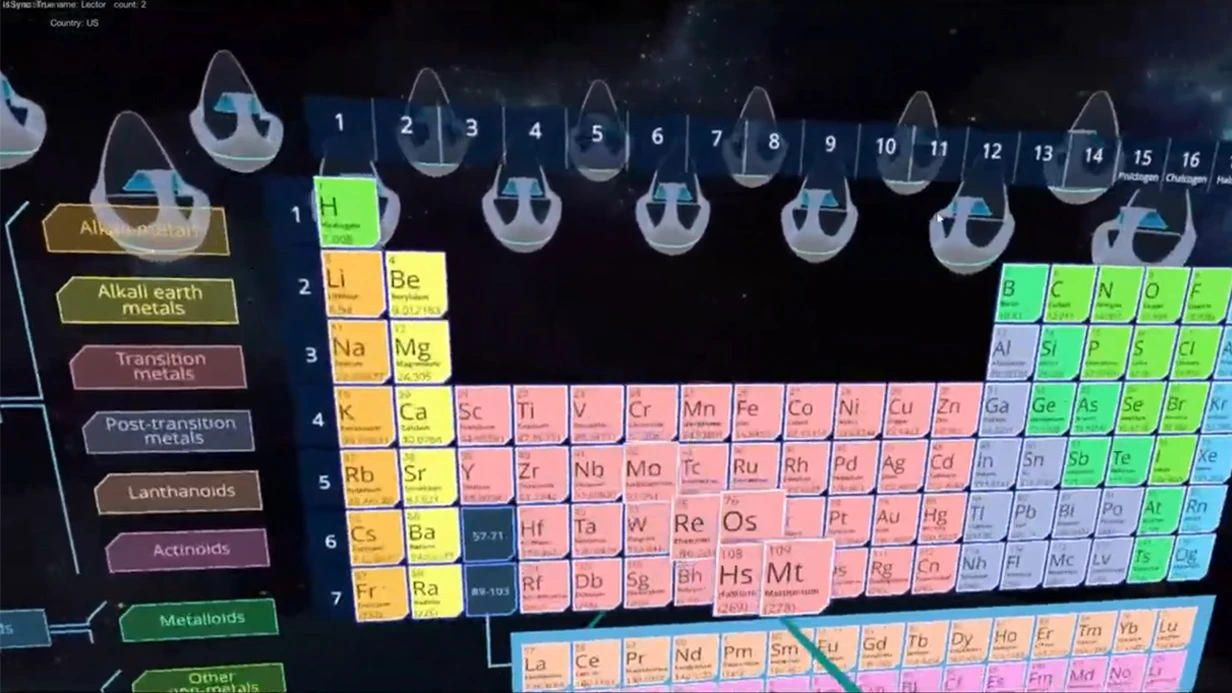
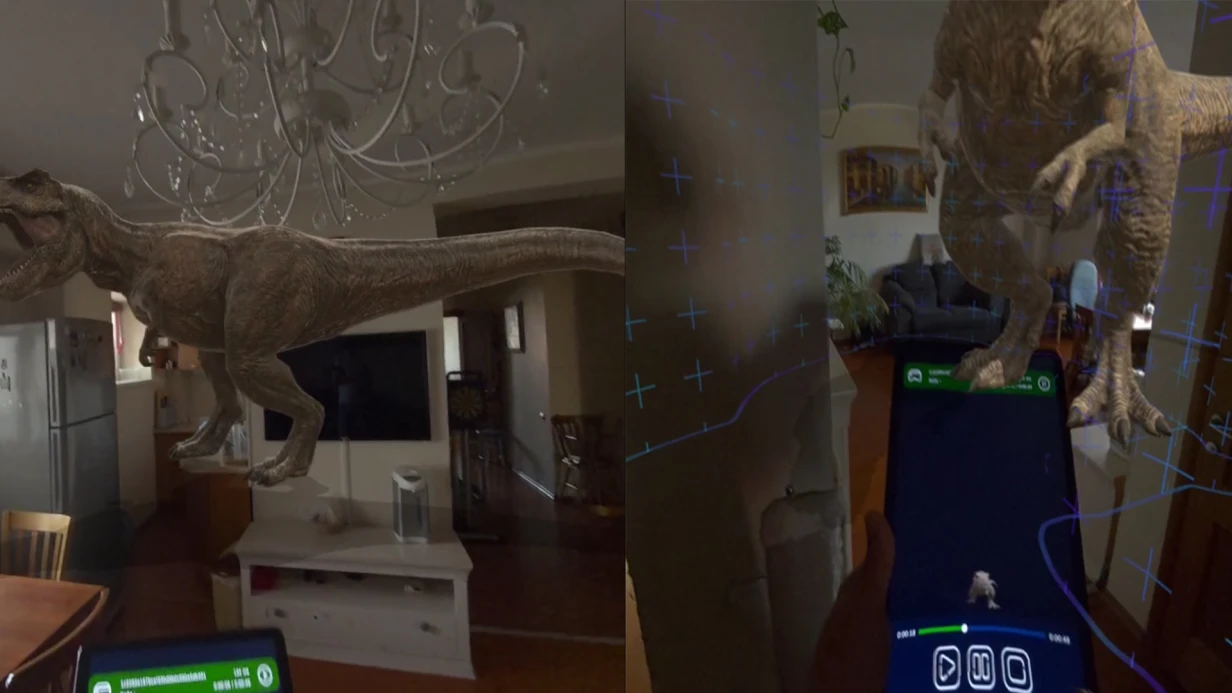
This is where interactive exhibits and immersive visualization come in. We turn dry datasets into living 3D models, volumetric charts, and virtual scenarios that you can literally "step inside" using spatial computing devices. The research becomes clear, memorable, and compelling.
This solves the main pain point of scientists and laboratory directors: instead of explaining with hand gestures, you show a tangible result that impresses and engages.
Partners see the value right away, and research presentations become a powerful argument for project development.
What interactive data visualization gives science and business
Scientific data is usually hard to absorb: tables, charts, and formulas require time and preparation. Interactive visualization turns them into clear 3D models that can be examined from every angle, taken apart, and seen in motion.
For a museum or exhibition project, this is a way to speak to the audience in the language of images rather than terms. Instead of dull displays, you get a space visitors want to explore.
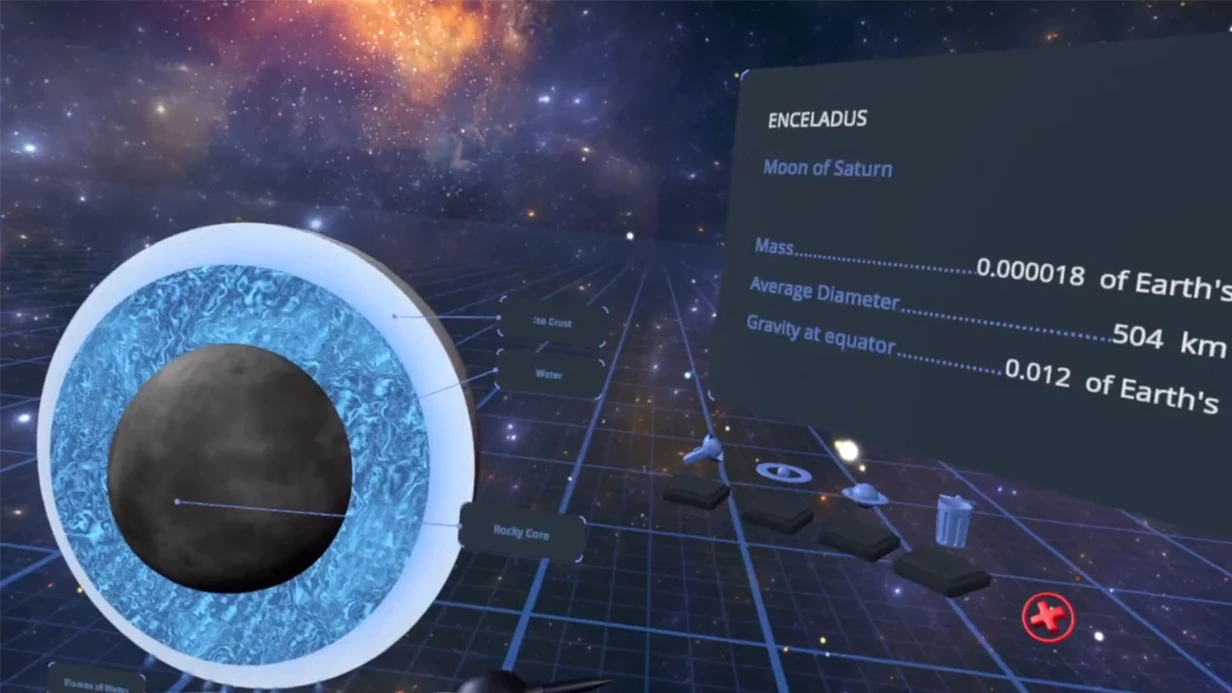
With Apple Vision Pro, we create spatial scenes where visitors literally find themselves inside the data. They don't need to read instructions — they naturally interact with the object: zooming in, rotating, launching a simulation.
This dramatically increases engagement: guests stay at the exhibit several times longer, come back to it, and discuss it with others. The experience sticks in their memory and brings them back — now with friends and family.
Visual clarity speeds up the understanding of complex processes — from cell structure to the movement of galaxies. A school student absorbs the material in minutes, and a partner or investor sees the value of your research faster.
As a result, trust in the project grows: you show not abstract data, but a living picture that can't be ignored. This directly strengthens the project's position in grant defenses and negotiations.
Engaged visitors also mean direct revenue. An impressive interactive becomes an attraction in its own right: people are willing to pay extra for it, lines form, and photos and videos from your space spread across social media for free.
Visualization pays off not only through its educational effect, but through commercial results — from ticket sales to sponsor interest.
Development formats: from exhibits to laboratory simulators
Scientific projects rarely fit into a single format: some need an interactive exhibit, others a training simulator, and others a virtual laboratory.
We develop solutions based on the client's objectives and built on Apple Vision Pro and other VR/AR devices — from public demonstrations to research experiments.
Below are the typical formats. Choose according to your task, and we'll help you pick the optimal option.
| Format | For whom | What it gives the client |
|---|---|---|
| Interactive exhibit | Museums, exhibition stands | Holds attention, clearly explains a complex topic, increases interest in the stand |
| Training simulator | Training centers, universities | Risk-free skill practice, higher engagement, faster material absorption |
| Virtual laboratory | Research groups, scientific departments | Simulating experiments without equipment costs, repeatable conditions |
| Presentation application | Conferences, investor reports | Clear demonstration of results, greater trust in the project |
Each format works as a standalone solution or as part of an integrated platform. For example, an exhibit can be supplemented with a simulator, and a virtual laboratory with a data collection module. We take on the entire cycle: from prototype to launch and support.
Solutions are adapted to the audience: the interface and complexity are tuned to the audience's level of preparation. You get a tool that solves a measurable problem — increasing reach, accelerating learning, or reducing experimental costs.
How the work is structured: 6 steps from brief to launch
Scientific research requires predictability: it's important to know what happens at each stage of the work. We built the process so you control the timeline and quality, and the result matches the experiment's objectives exactly.
- Brief and task immersion. An interview with the research group: goals, methodology, audience — scientists, students, or test subjects. We document what data to collect and how the application will fit into the protocol.
- Scenario design. We create the application structure, action logic, and visual solutions. You receive a prototype before development starts and can adjust everything at an early stage.
- Plan and milestone alignment. We lock in timelines, scope of work, and milestones. You see the schedule and know when each element will be ready — before the project launches.
- Development with intermediate versions. Every 1–2 weeks, we show a working fragment. You evaluate functionality and interface, make edits — no surprises at the finish.
- Testing under research conditions. We test the application with representatives of your target group: correct instructions, data recording, and no discomfort. We fix errors before the launch stage.
- Launch and support. We set up the application on your devices, hand over instructions, and train the team. We stay in touch after launch: we support, update, and help with data.
What's included in delivery: source code, documentation, and training
The project doesn't end with handing over the finished application. It's important that your team can develop the solution independently, add new research scenarios, and build on accumulated experience.
That's why we include everything needed to work confidently with the application and adapt it to new scientific tasks in the delivery package.
- Project source code — complete, current code with comments, structure, and explanations so that your developers or a future contractor can make changes quickly.
- Architecture and scenario documentation — a description of the operating logic, interfaces, and interaction principles: from gesture maps to data collection protocols for later analysis.
- Methodological materials for researchers — a guide on how to configure experiment parameters, run sessions, and record results without a developer.
- Team training — a practical workshop for developers and researchers: we show how the system works, how to run it, test it, and refine it. Training is held remotely and recorded.
- Operation and administration instructions — clear checklists for device preparation, application deployment, maintenance, and handling common situations.
- Support during the adoption phase — for a reasonable period after delivery, we support the project: answer questions, help with settings, and quickly release fixes when needed.
As a result, you get not just an application, but a full-fledged research tool that continues to work and evolve without our constant involvement. No vendor lock-in — only your results and the ability to scale experiments on your own.
Case study: how we helped scientific research speak to investors
When a research group comes to investors with a 60-page report, its ideas get lost in charts and terms. The research may be groundbreaking, but without clear visualization, it doesn't inspire trust. This is exactly the gap we close with our VR/AR solutions.
One illustrative case is working with the Institute of Neuroscience, which was preparing a presentation of years of research for an investment fund. The task was simple: show the essence of the discovery in 10 minutes without loading viewers with scientific details.
We designed a VR application where meeting participants put on a headset and "step inside" the experiment: they see living data models, change parameters, and watch how the results respond to their actions.
Instead of passively viewing slides, investors spent 20 minutes immersed in the research. After two demonstrations, the fund requested extended materials, and two weeks later negotiations on financing began. No institute presentation had held an audience's attention for so long before that.
Why it worked
VR visualization turned the research from abstract numbers into an experience you can "touch." For an investor, that reduces risk: they see not a promise, but a working demonstration. Measurable project results:
- duration of engagement with the research grew from 3 to 20 minutes;
- 8 out of 10 meeting participants requested materials;
- a repeat order for the next research stage came a month after launch.
The case confirms: quality research visualization pays off not with a one-time display, but with a series of business contacts and new opportunities for the scientific team.
What if you have a non-standard research task?
A non-standard research task isn't the exception — it's the norm. Ready-made templates rarely answer a specific scientific question, and standard applications force you to fit your methodology to the tool, instead of making the tool work for your methodology. We understand this and do the opposite.
An individual approach starts with analyzing your task: what exactly you're studying, what data you're collecting, and under what conditions the experiment runs.
Based on that, we adapt the scenario, interface, and application logic to your scientific field — be it psychology, medicine, engineering research, or the humanities. You don't have to change your methodology.
We take your hypothesis and turn it into a practical tool. Dialogue and expertise matter at this stage: our specialists know Apple Vision Pro inside out, but they speak to you in the language of science.
Together, we define the experiment parameters, ways to record results, and formats that make it convenient to export data for your statistics.
The client receives an application that solves their specific research task, not an abstract "VR headset." This kind of adaptation reduces experiment preparation time and increases the reliability of results. It also frees up your time for the science itself — instead of dealing with technical details.
Tell us about your task, even if it seems complex or non-standard. We'll propose a way to solve it.
Common concerns: reliability, compatibility, and security
Before launching a research project, we usually hear three groups of questions: about hardware reliability, technical support, and the fate of collected data.
These are fair concerns — scientific experiments shouldn't be interrupted by unexpected failures, and research results can't be lost. Below, we explain how each of these issues is handled.
What happens if the equipment breaks during an experiment?
We structure the process so you don't depend on a single device. For long protocols, we provide a backup kit, and the application automatically saves checkpoints to a secure server.
If a headset fails, you resume from the last saved position — without losing accumulated data and without stopping the research.
How is technical support organized throughout the project?
We support the application from the first launch to the final version: we help set up scenarios, adapt the interface to changes in the protocol, and quickly fix issues.
Engineers connect remotely during the business day, and for long-term studies we can assign a dedicated specialist familiar with your protocol. They can help at any stage — from a pilot test to large-scale data collection.
How is the security of scientific data ensured?
Experiment data is stored on an isolated server with restricted access. Only your research group has access to the raw results — we don't transfer materials to third parties and don't use them for our own purposes.
After the project ends, we hand over the complete archive and, upon request, delete our copies, so the data stays entirely under your control.
What you'll get after your order and how we'll begin work
After you reach out, you'll receive not generic promises, but a concrete plan for turning your scientific task into a working Apple Vision Pro application.
We begin by analyzing your research goals to propose a solution that will speed up data collection, simplify visualization, or automate routine work — exactly what your laboratory needs.
What's included in the first step:
- Initial consultation: we break down your task, target audience, and technical constraints.
- Idea audit: we assess how suitable Vision Pro is for your research and what results it will bring.
- Work plan with stages and timelines — you understand how long each step takes and what you get at the end.
- Prototype of the key scenario: you see how researchers or students will interact with the application.
- Transparent estimate with a fixed cost — no hidden surcharges or unexpected expenses.
- Recommendations for integrating with your IT infrastructure and data formats — the application will fit into existing processes.
This allows you to make a decision based on facts, not assumptions. We adapt the process to scientific cycles: we account for experiment periods, data processing, and publication preparation — you stay focused on the research.
The next step — leave a request on the website. We'll contact you within one business day, clarify the details, and send you a personal proposal. All that's left is for you to approve the plan — we'll take care of the rest.